Commercial cooling Tower Case Study ‐ 90 Day Evaluation
Case study updated on April 26, 2013
Installer: Nano Tek‐On ‐ HydroFLOW Master Distributor in Hawaii.
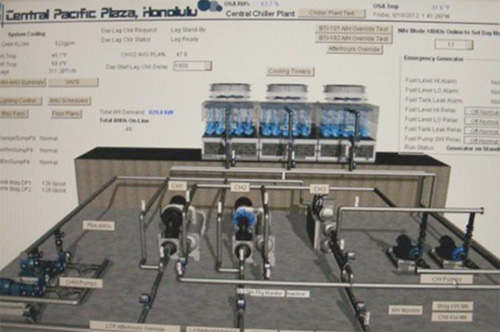
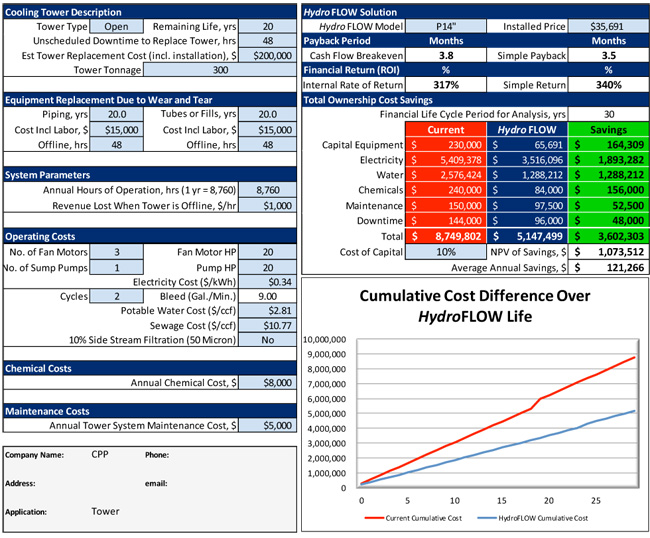
Customer: Central Pacific Plaza
Location: Honolulu, Hawai ‐ USA
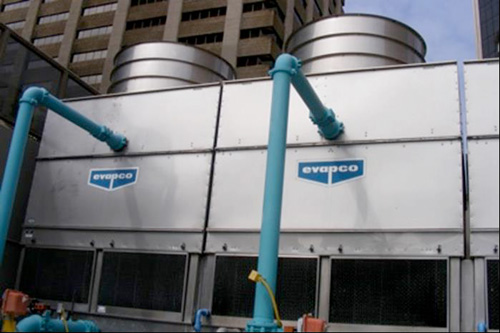
Application: Two 300 ton cells and one 75 ton cell ‐ One 300 ton cell operates during the day, one 300 ton cell is on standby and the 75 ton cells operates during the night
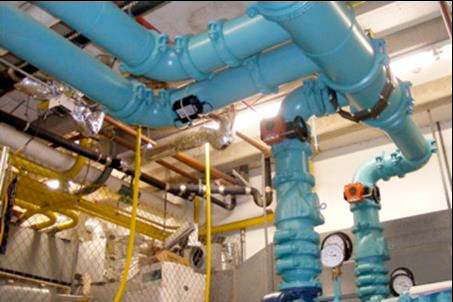
Unit: HydroFLOW 14" Custom on a 12.78" Outer Diameter Cast Iron Pipe
Goal: Keep biological growth, scale accumulation and corrosion rate under control while using minimal amounts of chemicals
Timeframe: Trial began on January 22, 2013 and ended on April 22, 2013
Evaluation Protocol:
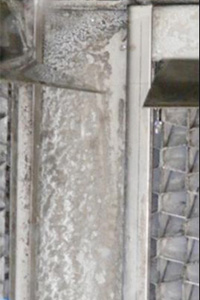
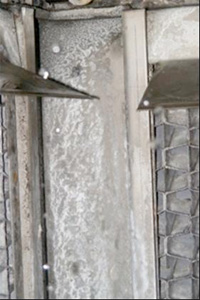
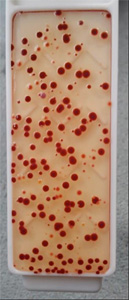
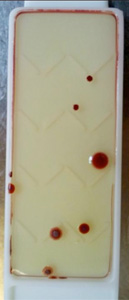
• Weeks 1-2: No chemical reduction. Biological water tests to be compared to baseline data after 15 days. Scale and bio accumulation to be compared to baseline pictures.
• Weeks 3-5: Scale/corrosion inhibitors and biocide to be reduced to 75% (25% reduction). Biological water tests to be compared to baseline results after 5 weeks. Scale and bio accumulation to be compared to baseline pictures.
• Weeks 6-9: Scale/corrosion inhibitors and biocide to be reduced to 50%. Biological water tests to be compared to baseline results after 9 weeks. Scale and bio accumulation to be compared to baseline pictures.
• Weeks 10-12: Customer to decide if scale/corrosion inhibitor and biocide can be reduced to 25% (75% reduction). Biological water tests to be compared to baseline results after 12 weeks. Scale and bio accumulation to be compared to baseline pictures.
|